Inaguration Crowd Size (2017)
“Everyone is entitled to his own opinion, but not to his own facts.” ― Daniel Patrick Moynihan
Estimating crowd numbers, evaluating crowd density and understanding safety limits for event capacity is an essential requirement for crowd safety and risk analysis. Where crowd counting can be very useful (after the event) we focus on a dynamic estimation process (using the RAMP analysis techniques). this allows for real-time predictive estimation and risk mitigation for places of public assembly.
Over the last three decades the same types of questions are asked during our short courses and workshops "I don’t know how many people might be coming to this event so what’s the best way to plan if we don’t have the numbers?"
I would only need to ask four questions before I could develop a crowd dynamics plan and risk assessment for the site
1. What direction will crowds approach and depart the area?
Route question (transportation hubs to and from event site)
2. What is your event capacity?
How much Area do you have? How will the area be used?
3. How quickly will these spaces fill?
What crowd Movements do we expect? Over what period of time?
4. What type of crowd are you expecting?
What type of People/Profile, are you expecting - what do you know of the crowd demographics?
With the above information it is then relatively straightforward to look at where, when and how congestion might build up, where queues may be expected and where you need to deploy stewards and security to manage the crowds. It was the application of RAMP analysis that allowed us to count, in real-time, the crowds at the 2017 Inauguration in Washington DC.
________________________________________________
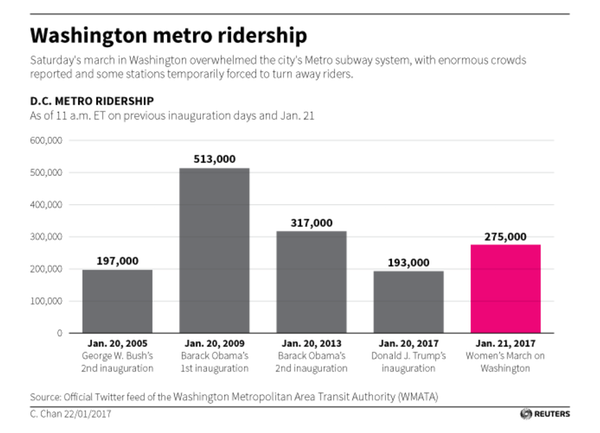
We were asked by the New York Time to evaluate the crowds at Trump’s Inauguration and the Woman’s March (20th and 21st Jan 2017). For both counts we used the RAMP Analysis technique (Routes, Areas, Movement and Profile/People) coupled to the car park data and metro ridership information. All three elements provide an overview of the crowd dynamics and allow us to evelaute, in real-time, the crowd build up.
________________________________________________
Our analysis at Manchester Metropolitan University
Article in the New York Times - click here for the link
________________________________________________
________________________________________________
Click here for the link on the Inaguration crowds 20th Jan 2017
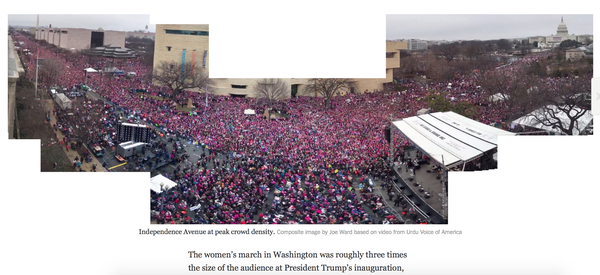
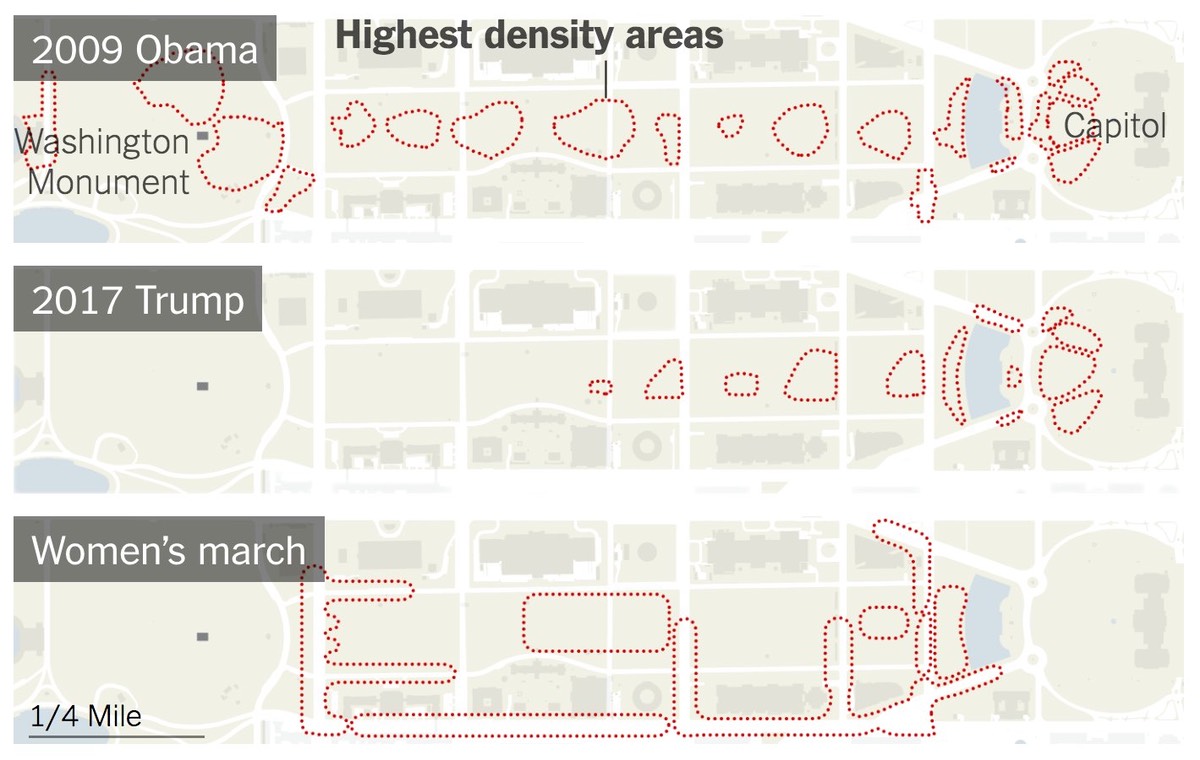
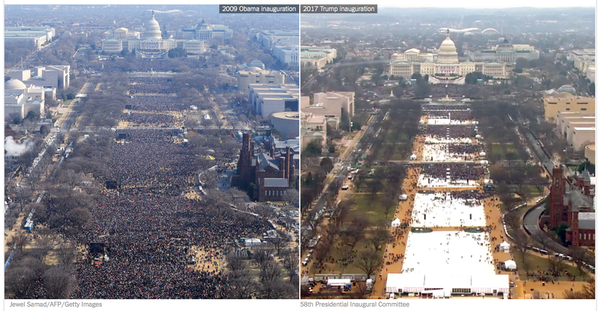
As any crowd analyst will confirm, the front fills first. In the images below, both the 2009 inaguration and the 2017 inaguaration enents had capacity crowds near the stage (seated) area.
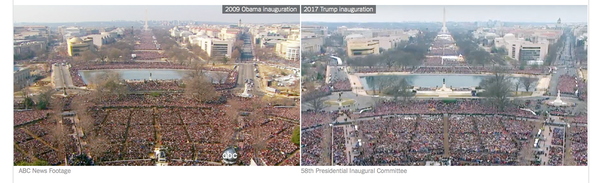
From the rear view we can see that 2/3rds of the area in the 2017 inaguration event are empty.
________________________________________________
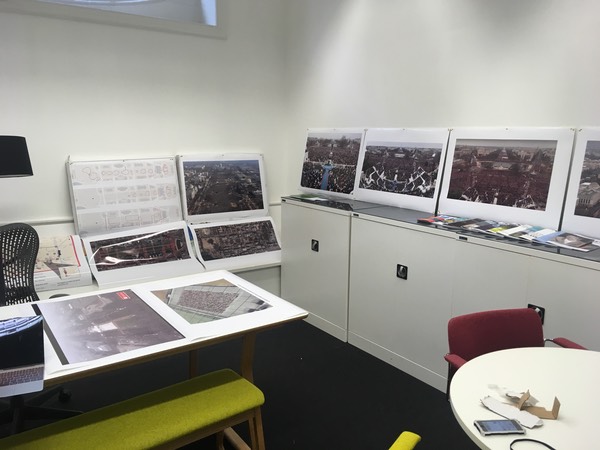
These two images (from live video feeds/published images) show the difference of the two crowds attending the 2009 (Obama) and 2017 (Trump) inauguration. Marcel Altenburg and I were working with low resolution live feeds during the inaguration.
Below are the analysis images we worked from during the event - live from 7 different video feeds to ensure these were both at the 45 minutes before the Oath of Office.
________________________________________________
Crowd Counting - in real-time
There are two types of event – planned and unplanned (organised and spontaneous gatherings). Planned events can be ticketed or free entry. Obviously, ticketed events allow an accurate capacity check – you calculate the safe holding capacity, number of seats/standing area and then sell that number of tickets.
So how do we calculate the crowd capacity and crowd numbers for the spontaneous and free entry events? We need to know the limits to avoid overcrowding and potential crown crushing. So how do we achieve this?
We start with the site area, the routes to/from the site and the safe capacity. That’s a simple calculation using various freely available tools – such as Google earth Pro – which allow the user to point and click an area, obtain a measurement of that area, and then to calculate a safe holding capacity. So, we can ascertain, before the event, how many people the site can safely accommodate.
Now, we need to count in real-time, to make sure we don’t exceed the safe limits. There are two methods of estimating crowd numbers – a count or a density check.
The first, is to count people in/out of an event space - this works well in closed spaces, such as a festival or mass gathering within a boundary, typically a fenced off area. Over the last decade, we have seen a variety of automatic counting systems, but none that provide a 100% accurate count at high volumes of throughput.
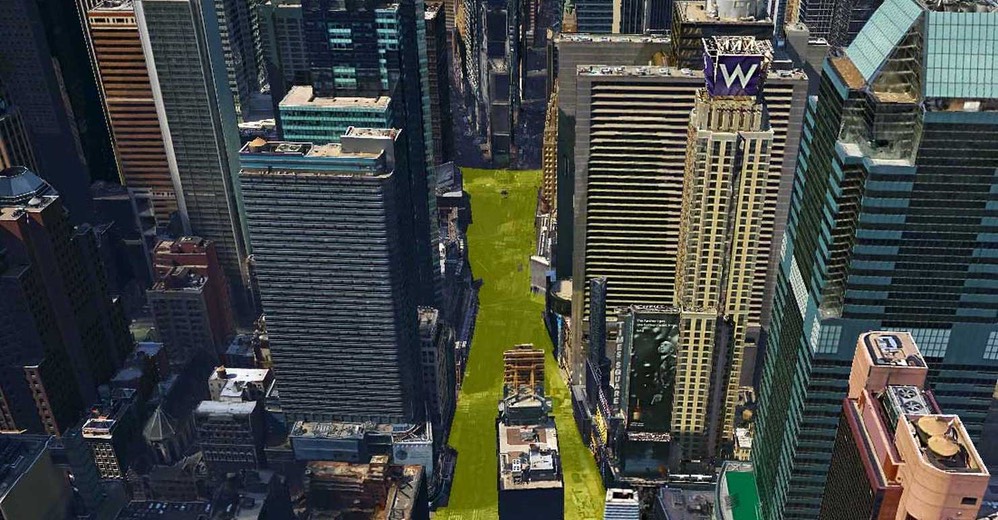
The second method, when you simply can’t count everyone (such as a network of streets/roads, open parks, and complex spaces or areas which have a high volume of input and output. These areas can be checked using a density evaluation - from a recent New York times Article - click here for a link.
In realtime - we can use this to evaluate the crowd build up on the site - click this link for more information.
________________________________________________
New York Time article
From Lincoln to Obama, How Crowds at the Capitol Have Been Counted
People have descended on Washington to witness, celebrate and protest since the cornerstone was laid on the Capitol building in 1793. But estimating the size of those crowds is not easy, and sometimes crowd-counting can be fraught with controversy. Here’s how the tools for counting have changed over the last 150 years. An analysis by Dr. Keith Still and Marcel Altenburg estimated that 7,350 people are in this view:
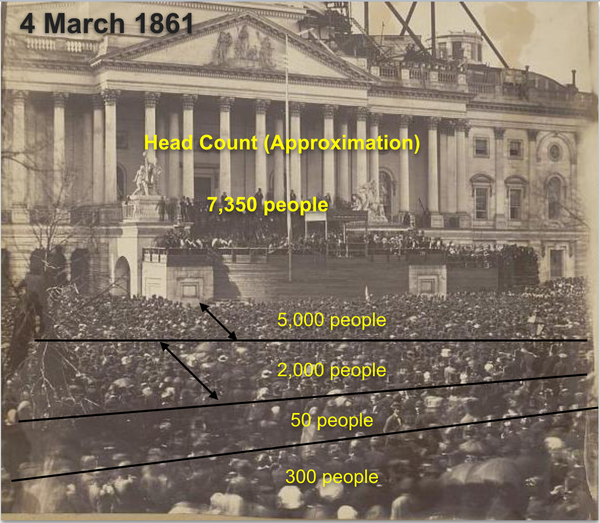
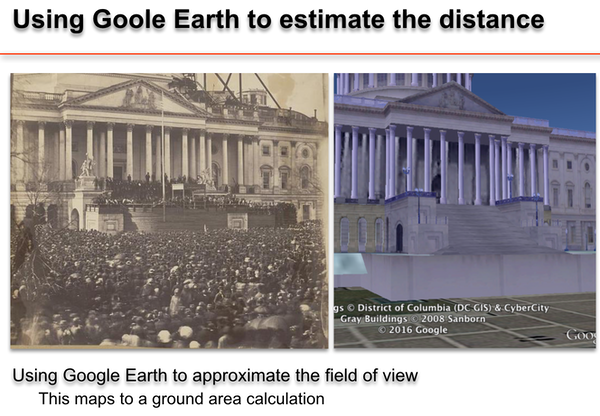
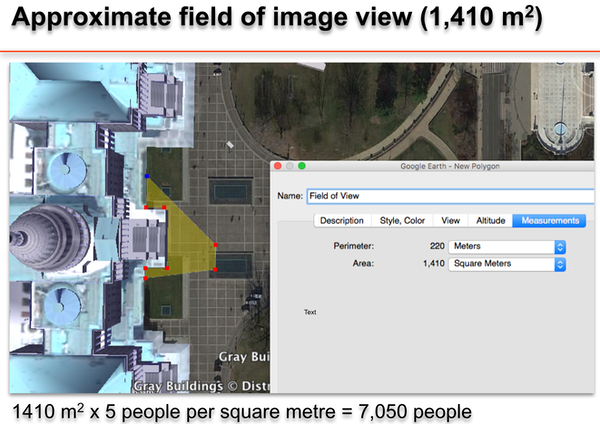
We can estimate, using area and a packing analysis, coupled to an image head count to estimate crowd numbers. In the above example. between 7,050 (areas x packing density) and 7,350 (head count). Note: the size of people in 1861 was approximatley 20% smaller than 2017 human dimensions).
________________________________________________
Using real-time estimates for decsion support
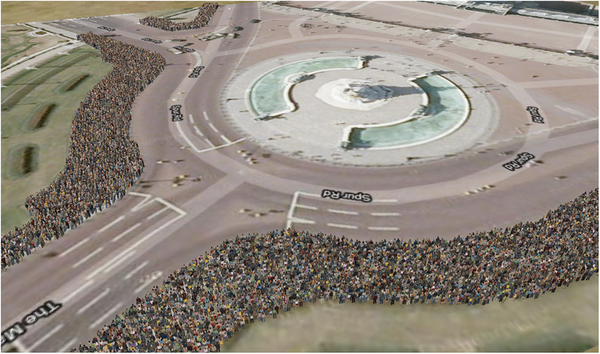
Modelling the crowd build up for the Royal Wedding 29th April 2011.
Furhter information on this link
and for control room decision support - click here
________________________________________________
Aritcle in the Washington Post (Jan 9th 2017)
Click on the title above for the full article
________________________________________________
Below are two projects from our MSc student, Alexandar Kollaritsch, featured in the USA press.
http://www.post-telegraph.com/news/experts-broncos-parade-estimate-3-5-times-too-high/
http://www.post-telegraph.com/news/a-look-at-methodology/
http://www.post-telegraph.com/news/through-the-transportation-lens/
_________________________________________________________________

For further information on crowd density and crowd flow - click here.
We run training courses around the world and an APEL short course linked to the MSc in Crowd Safety and Risk Analysis at Manchester Metropolitan University in the UK.
Contact us for further information - click here