Moving crowds require more space than standing crowds - it is important to understand the difference between the static space requirements and the dynamic (moving) space requirements for the crowd.
Above the morph from the walking and standing model to the profile images shown below.
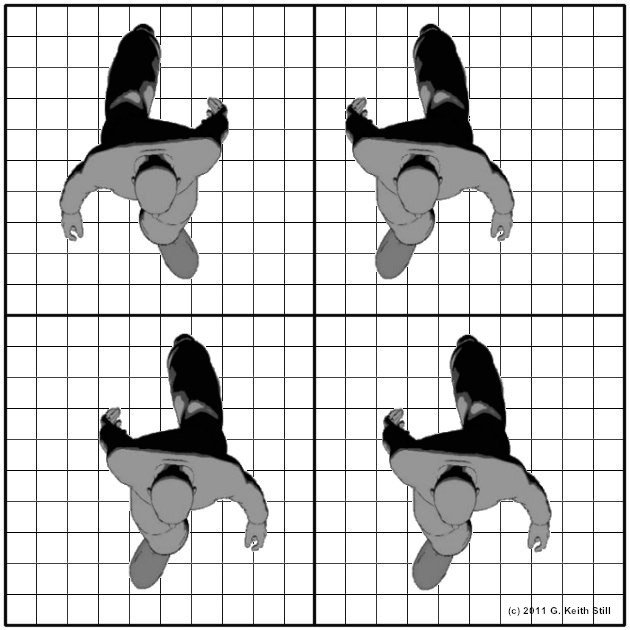
1 Person per Square Metre
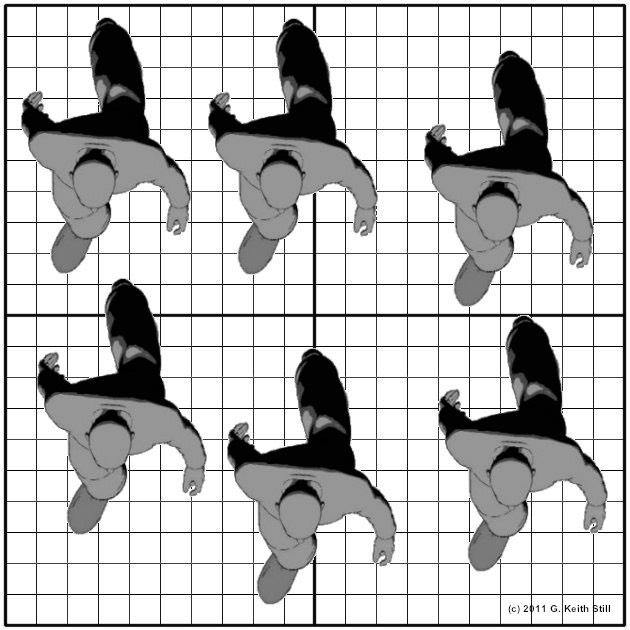
1.5 People per Square Metre
2 People per Square Metre
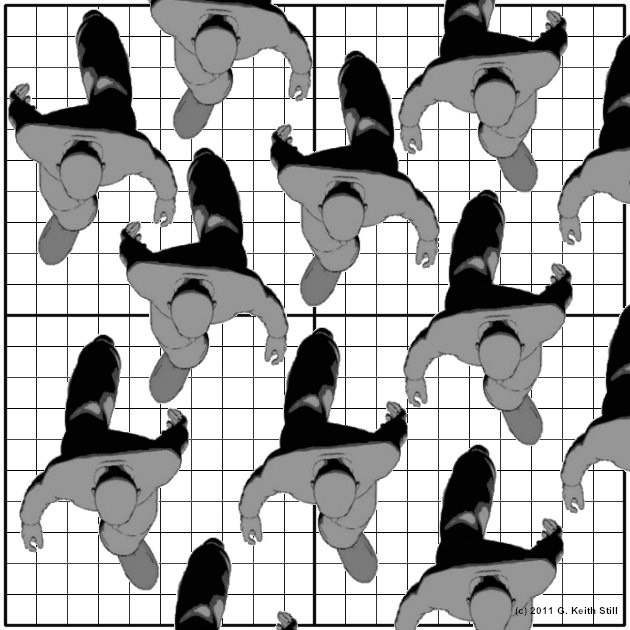
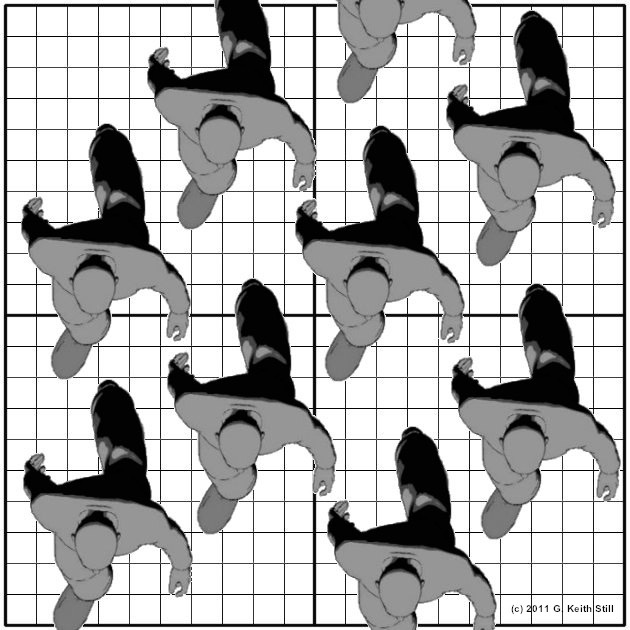
2.5 People per Square Metre
We observe critical density at 2-4 people per square metre.
As density increased flow increases, but only until critical density is reached (2-3 people per square metre). This critical density can be different for different events/crowds.
These links are short video clips of a workshops experiment I run to illustrate the relationships between crowd density (people per square metre) and crowd flow (people per metre per minute). As density increases the crowd flow rate drops. This is essential to understand when planning for crowded spaces.
Five people per square metre (walking in step)
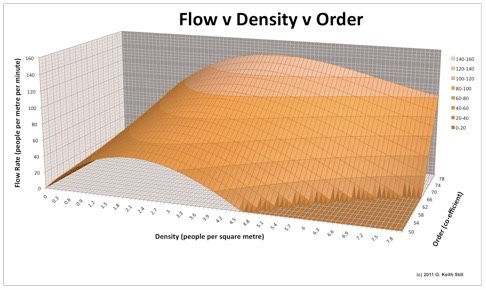
Flow versus density (animated graph)
As density (people per square metre) increases above the critical density the crowd flow rate begins to drop. Crowd flow is also a function of the crowd order. For example, armies marching can achieve a greater flow rate at higher densities than a mixed demographic crowd. Order in the crowd can increase the capacity density as the graph below indicates.