This is our old website - we are in the process of updating all the information on this site. For current information - check out our main site at
These pages showcase the work of Prof. Still, over the last 29 years across, a wide range of research and client projects.
_________________________________________________
Click here for information on our eLearning version of “Introduction to Crowd Science”
______________________________________________________
Over the last twenty years we have built a suite of crowd modelling, monitoring and risk analysis systems for major event analysis (hyperlinks below in red). Agents code is now based around a deformable frame (this allows the evaluation of pressure and simulation of shockwaves in crowds). Spatial analysis tools are now based on a single pass (multi-phase) algorithm which replaces the GH Cellular Automate code and the Network algorithms now use a polynomial flow rate (replacing the old linear estimation method).

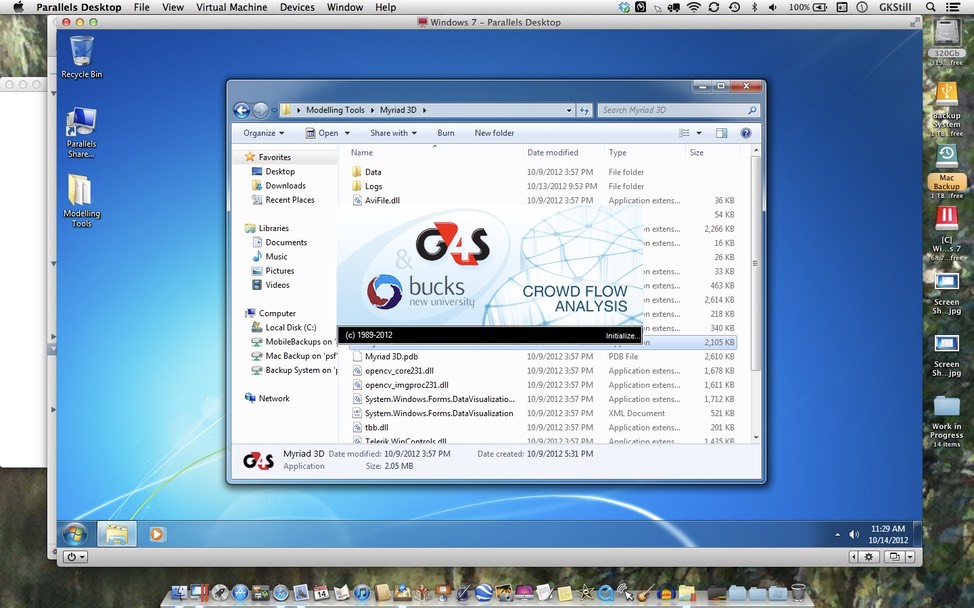
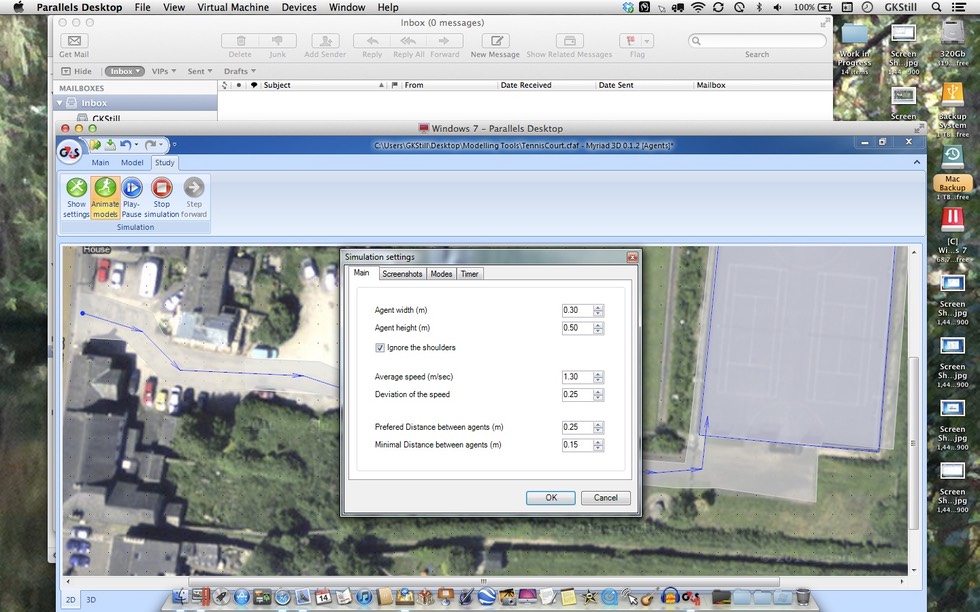
Above and Below - image of the Windows 7 modelling tools running under Parallels on my Macbook Pro.

This tool allows the user to import and site map/plan/image and position crowds. It calculates rates of fill, visualises crowds at various densities and produces 3D images of crowds in situ. This is a planning and control room tool allowing operators to visuals the crowds from any angle. I've used this on major projects including planning the Royal Wedding. Click on the link above for more details.
This tool allows the user to analysis the utilised spaces in complex environment. We developed and used this tool on the Jamarat Bridge project for both value engineering and risk analysis. Over the last few years the algorithms have been replaced and enhanced using a new mathematical principle. Click on the link above for more details.
This tool allows the user to define ingress, circulation and egress points in a system, connecting them to areas and obtain timing from flow rates, to predict fill times and times to reach critical density (fail times). The output is a site wide analysis for complex spaces. Following a series of field studies (click here for videos) the flow algorithms have been rewritten. The old two step nonlinear algorithm had a limit for multi-cultural demographics - the new algorithm is more robust for a wider range of crowd compositions.
This tool is the modelling system for complex behaviours and allows the user the ability to experiment with a wide range of options relating to crowd reactions. The latest modelling tools have a new algorithm for their crowd behaviour heuristics and movement code, replacing the older grid/shadow based version.
Outline of using the agent based simulation system to assess the dwell times for trains/platforms. The was developed for a number of train operating companies to assess dwell times under a wide range of normal and high density situations. We worked with Alstom, Bombardier, Interfleet, Porterbrook and a number of design teams evaluating platforms/stations.
Crowd Risk Analysis (progressive crowd collapse)
Analysis of progressive crowd collapse in static (front of stage) and dynamic (moving) crowds. Using this tool we can asses the risk of crowd collapse in complex spaces, assessing risk for different types of crowd behaviour in built and complex environments.
Crowd Pressure Modelling/Analysis
From Fruin "Cause and Preventions of Crowd Disasters"
Compressive asphyxia has occurred from people being stacked up vertically, one on top of the other, or horizontal pushing and leaning forces. In the Ibrox Park soccer stadium incident, police reported that the pile of bodies was 3 m (10 feet) high. At this height, people on the bottom would experience chest pressures of 3600-4000 N (800-900 lbs.), assuming half the weight of those above was concentrated in the upper body area.
Horizontal forces sufficient to cause compressive asphyxia would be more dynamic as people push off against each other to obtain breathing space. In the Cincinnati rock concert incident, a line of bodies was found approximately 9 m (30 ft) from a wall near the entrance. This indicates that crowd pressures probably came from both directions as rear ranks pressed forward and front ranks pushed off the wall.
Experiments to determine concentrated forces on guardrails due to leaning and pushing have shown that force of 30% to 75% of participant weight can occur. In a US National Bureau of Standards study of guardrails, three persons exerted a leaning force of 792 N (178 lbs.) and 609 N (137 lbs.) pushing. In a similar Australian Building Technology Centre study, three persons in a combined leaning an pushing posture developed a force of 1370 N (306 lbs.). This study showed that under a simulated "panic", 5 persons were capable of developing a force of 3430 N (766 lbs.).