We illustrate the flow versus density graph using both a colour and a graphic to show the density, the visuals of people per square metre and a colour scale for risk. A number of documents around the world, standards, building codes etc. use area per person. This can be confusing and we recommend that you always use density which is expressed as people per square metre. Density is easier to visualise and it maintains a clarity for crowd safety. This clarity is vital for decision making when in charge of places of public assembly.
To highlight this we run classroom demonstrations using a simple piece of string (area 1 square metre) and ask delegates to measure the time for a group of people to walk 10m. It's an illustrative experiment - but it highlights the curve shown below.
As density increased flow increases, but only until critical density is reached (2-3 people per square metre). This critical density can be different for different events/crowds. I used this tool (click here for a link to the 3D RTDS) to visualise complex sites - most recently for the Royal Wedding in London.
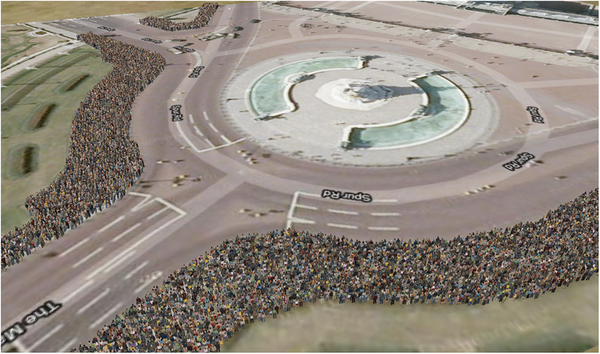
The tool was used extensively to plan the crowd numbers and density at key locations across London.
From the links below you can view a 10m grid, against a tennis court backdrop, to assist in visualising crowd densities and crowd sizes. I'm going to produce a whole range of crowds against backdrops to act as both a training aid and to provide reference visuals for assessing both density and crowd numbers.
Tennis court - reference crowd 100 square metres 1
Tennis court - reference crowd 100 square metres 2
Tennis court - reference crowd 100 square metres 3
Tennis court - reference crowd 100 square metres 4
Tennis court - reference crowd 100 square metres 5
Tennis court - reference crowd 100 square metres 6
Tennis court - reference crowd 625 square metres 1
Tennis court - reference crowd 625 square metres 2
Tennis court - reference crowd 625 square metres 3
Tennis court - reference crowd 625 square metres 4
Tennis court - reference crowd 625 square metres 5
Tennis court - reference crowd 625 square metres 6
Moving crowds require more space
Click on the links below for a video clip of:
5 people per square metre (marching in time)
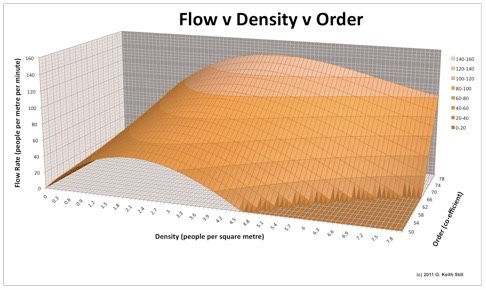
As density (people per square metre) increases above the critical density the crowd flow rate begins to drop. Crowd flow is also a function of the crowd order. For example, armies marching in step can achieve a greater flow rate at higher densities than a mixed demographic crowd. Order in the crowd can increase the flow rate as shown in the 3 axis graph below.
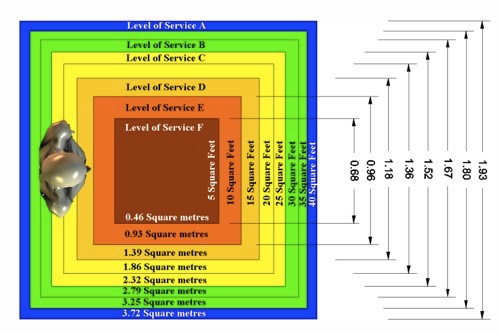
The Fruin level of service (LoS)
Crowd density (people per square metre) and crowd flow (people per metre per minute) are relalated.
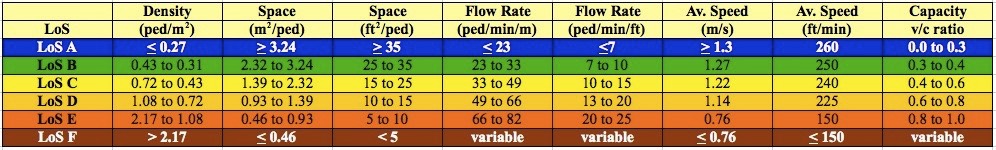
Which converts to the following density versus flow diagram (animated below)
Which is often illustrated as the diagram below.
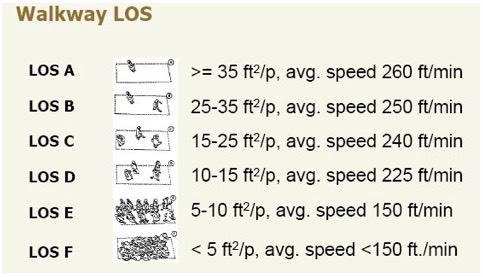
And can be illustrated using the following space metric (feet and metres)
As density increased flow increases, but only until critical density is reached. This critical density can be different for different events/crowds. As density (people per square metre) increases above the critical density the crowd flow begins to drop. Crowd flow is also a function of the crowd order, armies marching can achieve a greater flow rate at higher densities than a mixed demographic crowd.