4 Introduction
From the observations in chapter 2 we have highlighted several important features of crowd dynamics. In chapter 3 we discussed the problems in both the current guidelines and existing approaches to crowd modelling. Combining these factors together we are able to define the requirements for a crowd simulation. The objective now is to focus this simulation to the purpose of evaluating crowd safety.
To summarise chapters 2 and 3 with respect to the key crowd parameters:
- Crowds consist of many individuals each exploiting short cuts
- Crowds do not fill to their own level
- Crowds cluster
- Crowds have no collective intelligence
- Crowds are influenced by geometry
- Crowds self-organise at high density
Our simulation has to demonstrate the above criteria, and remove any operator biases. It should also enlighten and educate the user about issues of crowd safety.
4.1 Key components of a computer simulation
Computer simulations are voids in which the rules are defined by the programmer. There is a subtle difference between a correct physical model and the simulations used by the games industry. A computer game does not need absolute accuracy for the game to be convincing - it just needs to be realistic enough to fool the player.
To illustrate this, consider the movie industry with all of its digital effects and stunts. The hero of the movie walks away from the high speed car crash, brushes the dust off his tuxedo, and makes a witty remark about the incident. In reality, the identification of the occupants may require dental records. The mind is easily fooled.
(Update 2013 - this is an important aspect of much of my current work. Signage, information systems, what the mind see's and human perceptions).
When we create a simulation, it is important to understand the limitations of that computer universe. During the research phase several virtual reality platforms were investigated to find the limits of realism. The problem was highlighted during a visit to a major international software house, as the following anecdote makes clear:
A photorealistic model of the Goodyear airship had been produced with controls that allowed the user to manipulate the simulation, thereby flying the airship in the virtual world. During the demonstration the programmer commented:
“This control makes the ship go up” He said as he pressed a button and the airship rose vertically from the simulated landscape. “This control makes it go forward and backwards, and this control makes it go sideways”.
It was a spectacular model. The rendering was superb and it was difficult to tell whether you were looking at a model or a video of a real airship. However, the modeller had not understood that an airship is not a balloon! It flies. It is not possible for an airship to rise or travel sideways as he had demonstrated. But it was convincing, in the same way that the James Bond movie is convincing. It was an illusion. One has to be very careful in producing simulations. Convincing animations can look far more impressive than poorly displayed, yet physically correct models.
In the crowd simulation we need to model the properties of the crowd rather than the visual images of a crowd in motion. But we also have to consider the visual impact of the model. It has to look convincing to be acceptable, to be understood. Therefore the goal is to create a realistic images with realistic physics.
4.1.1 Defining the rules in a computer simulation
The physical laws that govern our universe are still unfolding and the basic interactions that dominate everyday objects still hold on to their secrets with unyielding determination. The effects of chaos dominate our physical universe and even the simplest systems can be unpredictable. To illustrate the problems of chaos and randomness, consider a billiard table as shown in Figure 54.
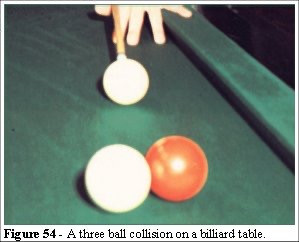
We know the laws of physics for this we could predict where the balls would go if we could measure the precise location and condition of the system. If we could measure all of the parameters with absolute accuracy, we could model this system and predict the precise outcome. We could then reproduce the initial conditions and play the shot perfectly, over and over again.
However, in reality, we find that even the most rigorous measurements of the balls’ positions have slight errors. There is nothing in the real world that is perfectly reproducible. The player’s accuracy changes with fatigue, temperature, alcoholic intake, mood, background noise - the list is endless. Even with a robot there would be slight mechanical differences in cueing position and angle. In reality, the final position of the three balls will be different every time it is played.
We live in a universe where the laws of chaos can effect the simplest of systems. That is the paradox: a computer-generated world is perfect, too perfect! To reflect our universe the laws of chaos must be included the simulated world. The goal is to create an accurate simulation of a dynamical system which includes the correct level of randomness and its consequences.
4.1.2 Modelling movement in a simulation
There are many ways to create a moving object in a computer simulation. Dynamics based on the physical properties could be created and coded into the object but this is not appropriate for modelling people. People do not behave like billiard balls. Our simulation has to capture the essential elements of how people read and react to their environment. Unlike the billiard balls in our example, people can choose their own direction, so our simulation has to reflect these behavioural choices.
There are two approaches we could use: Algorithmic or Dialectic. Strictly speaking the dialectic approach does not really provide a solution, but it clearly indicates that a solution exists. But if we can demonstrate that a problem exists, then by altering the parameters of the model we can find point at which the situation becomes unsafe. It is that insight which leads us to a solution.
Unlike the dialectic approach, applying an algorithm does not enlighten the user about the nature of the problem. This is why the system of algorithmic safety levels is failing in its application. For example, a flow rate of 660 people per turnstile per hour is algorithmic. We have seen from the Wembley turnstile data that, with the appropriate visualisation, an algorithm may not be accurate. We discussed Braess’s paradox in chapter 3.3, we can see that by adding an alternative route, we may not improve a circulation problem.
The Primrose Guide also states that Class B buildings require a minimum travel distance from any point to an exit of 18 metres. We can see that the simplicity of these calculations does not consider the complexity of the environment.
If we consider that these calculations are based on densities of 2 people per square metre, then there is the further complication of an inherent speed reduction at this density. This dynamic relationship is not part of the Primrose egress analysis.
Another point to note is the definition of a unit of exit width; defined in the Primrose Guide as not less than 750mm, with the further proviso that ideally each exit should be a minimum of 2 units wide (1.05mm is stated as a minimum). Given 4 exit widths and taking the 109 people per minute per metre figure we can see that the Green Guide calculation of 1090 people in the 2 ½ minutes is less than the 1230 people calculated in the Primrose calculation. Furthermore the calculations assume that the crowd distributes evenly to all of the exits. There are many examples cited in Fires and Human Behaviour [40] that give the lie to this algorithmic approach.
(2013 Update - the inconsistence in the guidance still persists to this day. The Fire codes generally relate to units of exit width and are in line with the 82 people per metre per minute. What users seem to overlook is that a unit of exist width is larger than a single person but not large enough for two people. This is an important factor when considering rates of egress. The 109 people per metre per minute figure above was reduced to 82 people per metre per minute in the 5th Edition of the Green Guide and is now in line with internationally accepted flow rates).
Based on the observations from the Wembley turnstile data, algorithmic or prescriptive calculations do not lead to the insight necessary to understand the problems associated with the speed/density/geometry relationship. The events at Hillsborough are a testament to these dangerous assumptions.
The impact of Braess’s paradox can make the addition of exit routes in an egress system lead to a slower system, for safe, overall evacuation. It is not surprising that the Guides make no mention of this, for the result is not intuitive. Network analysis and graph theory are complex mathematical subjects: their application to a design is not a trivial matter.
4.2 Computer simulation v network analysis
Network analysis and linear programming are mathematical modelling tools which have numerous applications for determining the maximum or minimum flow of elements in a network. However these techniques are not appropriate for a system that has nonlinear elements, chaos and random cause and effect [75].
Human traffic flowing through a network will have a chaotic or random element affecting the outcome. We need to know the limits of our calculations and the reliability of our results. We also need to know whether crowds have chaotic dynamics in a given environment.
When network analysis techniques can be applied to human traffic analysis, the results are often difficult to visualise. Network analysis proves difficult to apply to reality, as any town traffic planner can confirm.
Our simulation has to be capable of modelling and visualising nonlinear events. The system also has to allow rapid modification of all parameters, such as behavioural dynamics, random variables and event triggering. The component elements of the system have to be programmed with decision-making criteria; individual entities have to adapt to their surroundings using simple rules. Provided we have taken care in defining the rules of the system we are left with a dialectic problem-solving technique. To illustrate this let us consider a problem of evaluating an emergency egress from a building with the same parameters as the Primrose example. We randomly populate the environment and allow each entity to choose an exit. We do this in three stages, first by allowing the entities to choose their nearest exit (the Primrose criteria), secondly by choosing a random exit, and thirdly by forcing all the entities to choose a single exit.
(2013 Update - This was a hand-crafted technique, and still is, where the user has to define the routes. My later models perform a spatial analysis without the user having to define the routes).
The results of these three tests provide us with the insight to egress that we need to satisfy our safety criteria. Clearly if all three simulations demonstrate satisfactory egress in the recommended time then we can be assured that the design is adequate. However, if one of the scenarios fails then we have a dialectic solution. We do not know why all the entities may choose the same exit from our model - but we can prove that if they do then fatalities will occur. This techniques uses the system as a “what-if” tool, highlight potential disaster scenarios.
Emergence, in which the behaviour of the whole cannot be meaningfully reduced to the behaviour of the individual has been applied to modelling flocks, as we now describe.
4.2.1 A Flock of Boids
An example of an emergent approach to programming was demonstrated by Craig Reynolds of the Symbolics Corporation in Los Angeles [76, 77, 78]. He formulated some rules during the creation of artificial flocks called boids. These are:
- Try to maintain a minimum distance from other objects in the environment, including other boids.
- Try to match velocities with boids in the neighbourhood.
- Try to move toward the perceived centre of mass of boids in the neighbourhood.
Computer simulations of a collection of boids demonstrate a surprising model of a flock of birds, yet their rules include a specific rule instructing the boids to flock. The rule that states moving towards a centre of local mass is a flocking rule. It is not surprising, therefore, that they flock.
4.3 Programming people
We outlined the basic rules in the VEgAS system. We can expand on these rules and outline a series of tests which prove that they are capable of modelling emergence. For our application to crowd safety we also need to highlight the requirements for applying these rules to crowd simulation. We discuss these rules with respect to the works of the crowd psychologists Sime, Canter [40-47] et. al
The rules relating the behaviour of entities to the behaviour of the crowd: Objective, Motility, Constraint and Assimilation (OMCA), are
- Objective - Try to move to a desired or intended end point.
- Motility - Try to maintain your optimum velocity.
- Constraint - Try to maintain a minimum distance between yourself and the other objects in the environment.
- Assimilation - Delay time taken to read and react to the environment
The application of these simple rules produces an unexpected result in the flow pattern. The observed flow is concave, the sides move faster than the middle. With less distance to cover, the characters in the middle should be quickest through the exit, but this is not the case either in the model or in real life.
The applications of our simple rules here have produced the type of emergence we required. Furthermore there are no group behaviour rules involved, neither have we had to include psychological parameters.
4.3.1 Objective and Constraints
In chapter 2.6 we discussed the problems associated with Hillsborough. We shall now consider the dynamics of that situation with respect to the OMCA rules.
Consider the Objective: get to pens 3 and 4. In light of Helbing’s rule (chapter 3.5.6) we see that the Constraint in Figures 27 and 55 is the turnstiles A-G. The tunnel entrance (see Figure 55) is 3 metres wide, so at 109 people per metre per minute the flow capacity of this tunnel would be 327 people per minute. The seven turnstiles, estimated at the time as 1,000 per turnstile per hour by the club, would be expected to discharge spectators at 117 people per minute. Clearly the capacity of the tunnel exceeds the capacity of the turnstiles. The exit gate C (Figure 55) is 4 metres wide, and its capacity is greater than the tunnel capacity.
(2013 Update - again the figures of 109 people per metre per minute are based on the guidance at that time. This figure was reduced to 82 people per metre per minute in the 5th Edition of the Green Guide)
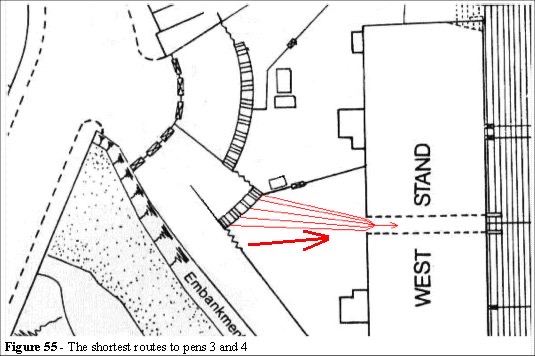
The ingress at gate C (opened to relieve the pressure outside the grounds), where the observed flow was counted as 2,000 people in 5 minutes, adds to the total. Therefore we have the total ingress capacity at 517 people per minute and the tunnel capacity of 327.
In the introduction to chapter 4 we stated that a crowd consists of many individuals. If we assume that they are all trying to achieve the same objective, to go to pens 3 and 4 via the tunnel, then they will exploit the shortest route. The shortest, or focal route, is obvious in both cases. This is the path of least effort.
The crowd is influenced by geometry, as we have seen from the examples in chapters 2 and 3, and this effect can be determined a priori. We can build a virtual reality model of the site to determine the focal routes, those routes that are most obvious and are visibly short cuts. This can then be used to determine the flow routes of the crowd. We can also use some simple geometric rules to determine the minimum distances an individual would travel to get to their objective. We can use the Green Guide to determine the constraints, but as we have seen those guidelines may be deficient in their assumptions.
As individuals are heading only for the short cut, we can argue that in this case the greedy algorithm is not implicit. A network model of this environment would give the wrong answer as it would assume that the greedy algorithm is implicit. However the OMCA approach provides the correct solution.
The crowd heading towards the tunnel has a unique dynamic. As an emergent system the sides of the crowd move faster simply because they are less constrained by the speed/density relationship carrying those in the centre of the crowd into the tunnel. There are no mysterious forces at play, only the simple features of the OMCA relationship. We shall discuss this in greater depth when we look the simulation output analysis.
As we can see from the postmortem analysis of Hillsborough (and many other events highlighted in chapter 2.1) people can and will put themselves into dangerous positions. It is also clear that clustering and self-organisation of crowds are essential elements of a safety system. The system has to therefore take this into consideration in order to assess the factors of risk involved in high density crowds.
We are defining the criteria for a safety analysis based on, dumb, short cut exploiting, self-destructive, individuals capable of packing to high density and following routes that are fundamentally geometric in nature. These are included in our Objective and Constraint definitions.
4.3.2 Motility and Assimilation
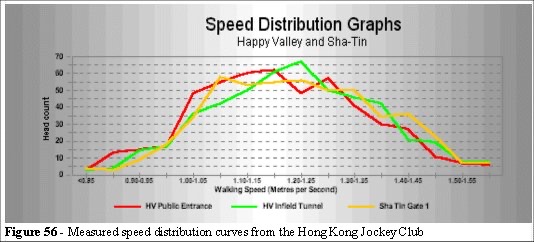
The Motility parameter in the crowd system relates to the unimpeded speeds of the individual. From Fruin, Helbing, Togawa, Ketchell, Paulsen, Kendik [79, 80], Henderson and Still [81] the speed distribution curves are (approximately) normal. The curves in Figure 56 were measured from a series of site surveys.
It is speculated that the speed/density relationship should be a function of the individual unimpeded speeds of the individuals. We shall discuss the effects of different speed distribution curves later in chapter 6 when we discuss the validation of the simulation. We shall also demonstrate that the speed distribution has other effects on the crowd dynamics. These relate to the clustering phenomenon.
Assimilation, the time taken to react to a change in the environment - for example, reaction to rain, warning alarms, reading signage or the movement of others - have been documented by Sime and Canter. This is a neglected factor in the Green Guide, which assumes that evacuation time is a function of travel distance.
Sime in his paper on human behaviour [46] clearly identifies in field studies that a 2/3 to 1/3 rule of thumb might be applicable:
The most important finding of the research is the fact that the start up time (i.e. peoples reaction to an alarm) is as (if not more) important as the time it takes physically to reach an exit. ... On average two-thirds of the time from onset of the alarm to reaching an exit was spent by people not moving at all. On average one-third of the time was spent in moving from seat positions to an exit.
Sime[44, 45] also suggests that the two-thirds/one-third division might be taken as a rule, not for calculating exit widths, but for representing the true nature of the egress time problem. He supports his findings with numerous examples [84].
He suggests that the two factors Time to start to move and Time to move should be combined in a simple formula.
Egress time = Time to start to move + Time to move
This gives the lie to the assumption of the two and a half-minute egress time, and the egress times calculated in the Green Guide based on movement alone. In the crowd simulation we shall refer the time to react as the Assimilation time, the time it takes for the individual to start to move.
We can now simulate various scenarios by applying randomness to the models. Again these are dialectic in nature in that we need not know what factors these elements of noise represent, only that above certain levels of randomness we begin to have egress problems. We can then look to reduce the randomness in the system with more effective signage, better design or active crowd management. (Note: The Simulex system allows the operator to set this parameter and test various egress times by altering this parameter per individual).
4.4 Crowd psychology
Sime [43, 44, 45,4 6,47] defines thirteen parameters that are identified as important in the assessment of emergency egress. These are as follows:
- Communication Method of alerting the crowd, fire bells, warning announcements. Sime has demonstrated that the fire bell is now largely ignored. This adds to the Time to start to move factors. Communication is not restricted to alarms: factors such as environment (changes in temperature), other people’s movement, sounds, smells and visual clues can also trigger the reaction of the individual.
- Mobility The speed at which an individual is capable of moving. Elderly, infirmed, the very young and the very old are located in different positions on the speed distribution histogram.
- Social Affinity It has been observed (Sime, Canter, Helbing et. al) that social affinity is an important factor in the dynamics of emergency egress. This relates to the position in the affinity cluster (for example, a family group father, mother and child behaviour).
- Alertness The individual will react at different rates depending on the state of alertness.
- Role Sime highlights that the role of the individual is important in their reaction to an emergency. In the Bradford disaster (referred to in the Poppelwell Report [82, 83]) the role of the police, their numbers, location and position of authority, were determining factors in the crowd behaviour.
- Position This relates to the individual, in that a seated person will react differently to a standing individual. Obviously an individual who is lying down (resting or asleep) will have different rates of response to emergency situations.
- Commitment Canter states that the individual reacts differently to an emergency (such as a fire) in the home than to a fire in, say, a hotel.
- Focal Points Sime et. al. identifies that visible egress routes are a defining factor in the emergency egress behaviour. This is also in line with the observations of Helbing and the author during site analysis.
- Familiarity The more familiar the individual is with emergency procedures and the building layout, the less the Time to start to move will be. We shall refer to this as the Assimilation time.
- Visual Access The more visible the signage, emergency egress route, or in the case of Hillsborough the ingress route, the more attractive the route will be to the individual. This is a geometric factor.
- Population Density The dynamics of the crowd dictates the egress behaviour.
- Enclosure Individuals have a desire to reach safe ground. It was noted in the King’s Cross Fire [40] that there is a tendency for individuals to try to reach ground level, although it is safer to remain underground as heat, and fire, rise due to thermal effects.
- Complexity The more complex the environment the more indecision there will be during an emergency. This will add to the total egress time for both assimilation time and movement time. The combination of Braess’s paradox and signage problems contributes to the complexity of the building.
Sime goes on to define criteria for changing the awareness of the above to facilitate more rapid egress behaviour. There are numerous papers on psychological factors at work in emergency egress behaviour (see the Bibliography for further references).
4.4.1 Psychology and the OMCA rules.
We can define all of the psychological factors in our OMCA framework. The assimilation times (for example time to react) can be modelled using a number of locally assigned factors. The following table indicates how the psychological characteristics relate to our framework of OMCA rules.
- Communication Assimilation
- Alertness Assimilation
- Mobility Motility
- Social Affinity Objective
- Role Objective
- Position Assimilation
- Commitment Assimilation and Objective
- Focal Points Assimilation and Objective
- Familiarity Motility, Objective and Assimilation
- Visual Access Motility, Assimilation and Objective
- Population Density Objective, Motility and Constraint
- Enclosure Objective and Assimilation
- Complexity Objective and Assimilation
The values of these parameters are user-defined, and we shall see, in some worked examples (chapters 7 and 8, the case studies), how they can be determined from video analysis and site data.
4.5 Conclusions to Chapter 4
We have discussed the various parameters necessary for a safety simulation. These include non-homogeneous flow characteristics. Treating the speed versus density relationship as a formula leads to inappropriate egress estimates, as does assuming the crowd will react immediately an alarm is sounded.
We have outlined how various psychological factors can be included in a model as they manifest themselves in the movement of the individual. In defining the Objective, Motility, Constraint and Assimilation framework we have reduced the complexity of the system to its basic interactive elements and these are demonstrated to fulfil the Einstein criterion:
Simplify - but do not over simplify.
As the model is entity-based the effects of individual speeds accumulate, the crowds cluster and this leads to the insight of how and why the crowd displays the effects we have seen in clustering, cornering and distributing. We shall now demonstrate that the model based on the four rules fulfils the criteria of simulating the dynamics of crowds.
Chapter 2 - Crowd problems and crowd safety
Chapter 5 - Legion (agent based simulation)
Chapter 6 - Validation of a computer model
Chapter 7 - Case study 1: Balham Station