The impact of crowd density (the number of people per square metre) for a standing crowd and a moving crowd is important to understand for crowd safety. For example, to assess the efficiency of crowd movement, throughput and rates of fill for places of public assembly you need to understand the relative risks of both standing crowd density and the moving crowd density. The diagrams below illustrate the standing density in people per square metre. This page (click here for link) shows the moving crowd density requirements.
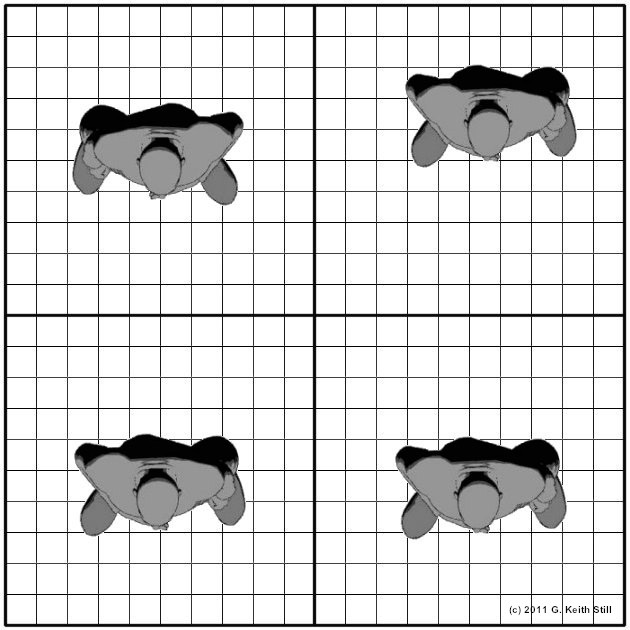
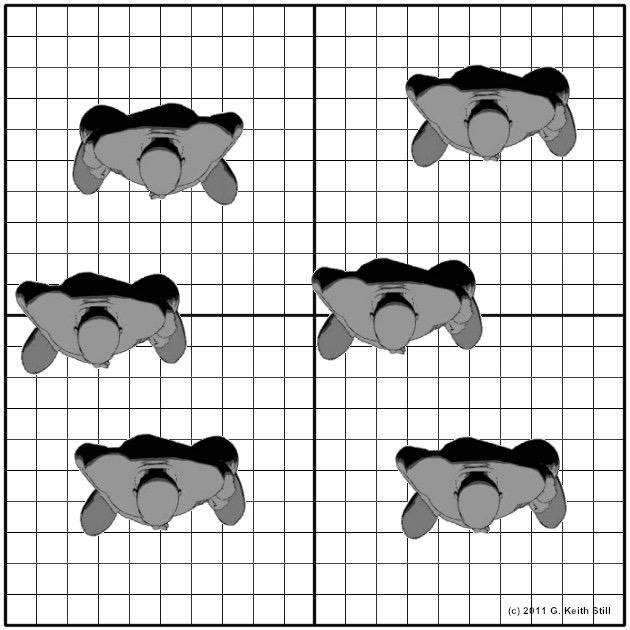
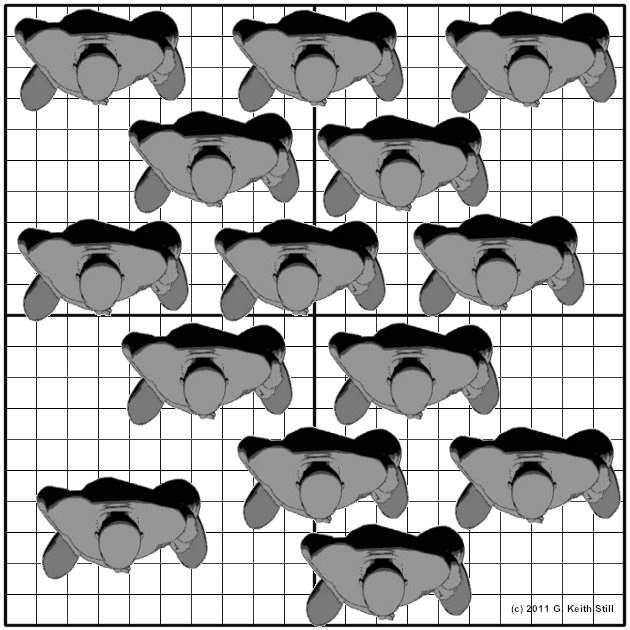
1 person per square metre. Above the image is created with one person in each square, below 1 person per square metre but with random distribution (2 people in one square and 0 persons in the fourth). Both of these images represents 1 person per square metre packing density. Crowds rarely pack in regular formation.
Above and below - 1 person per square metre (crowds rarely pack to a perfectly even distribution)
Above and below 1 person per square metre.
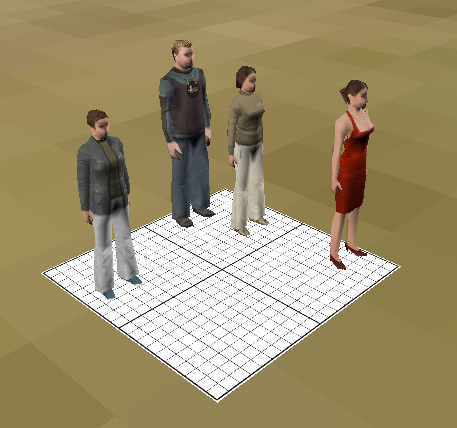
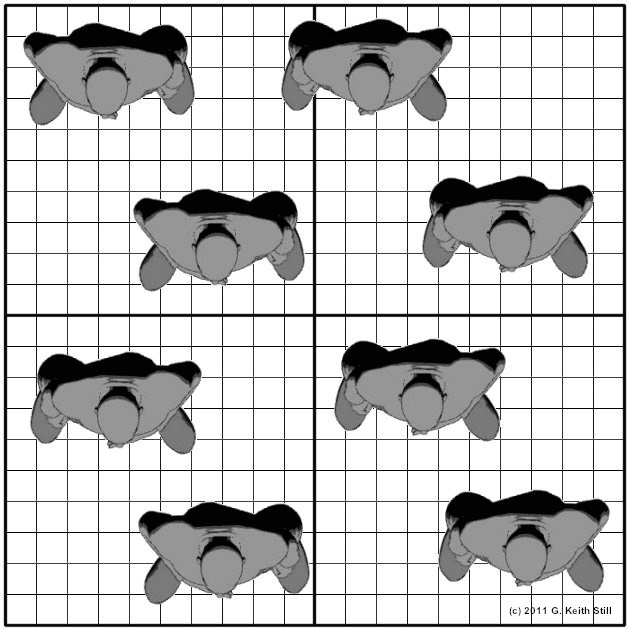
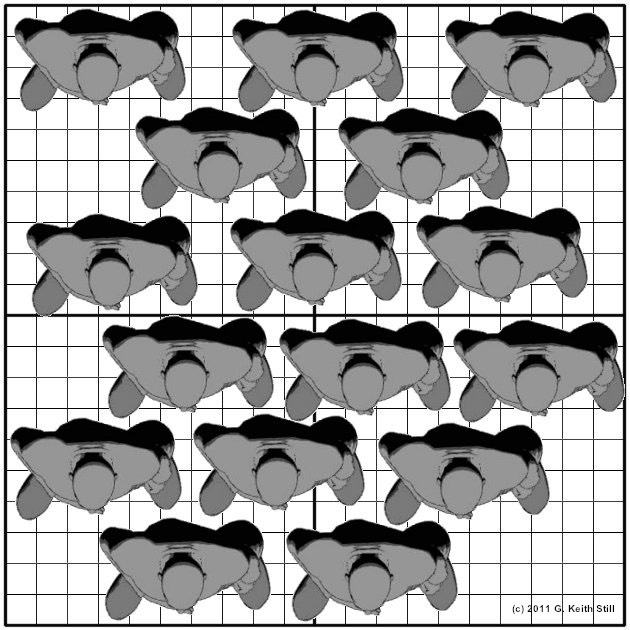
1.5 people per square metre
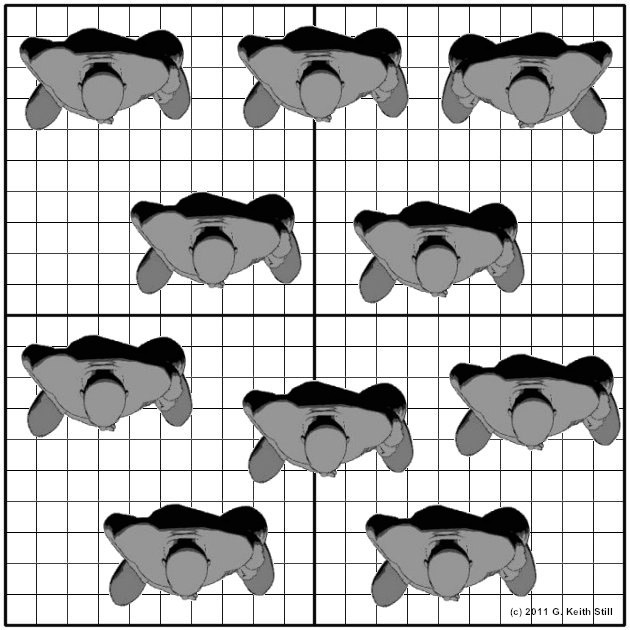
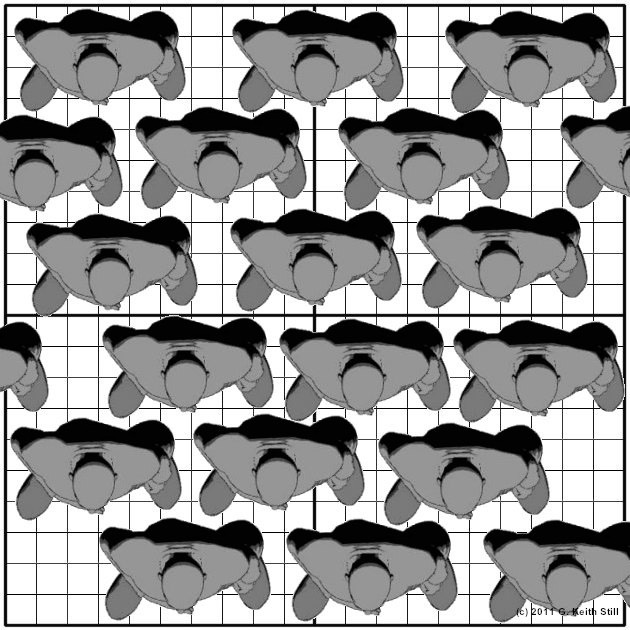
2 people per square metre
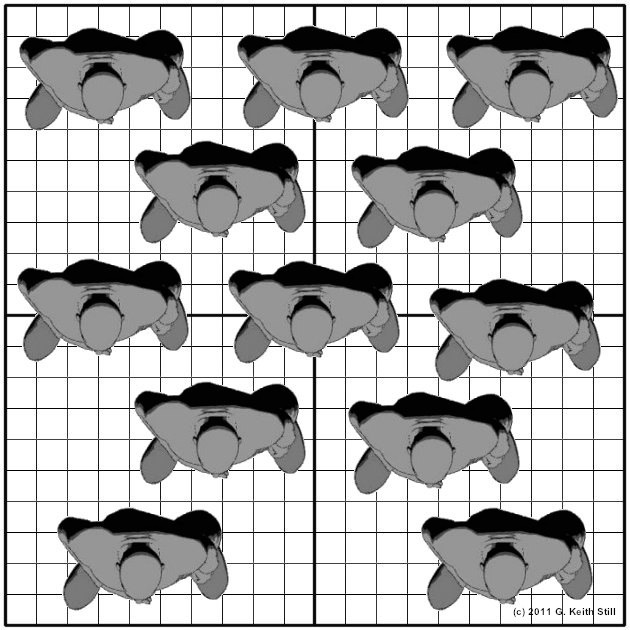
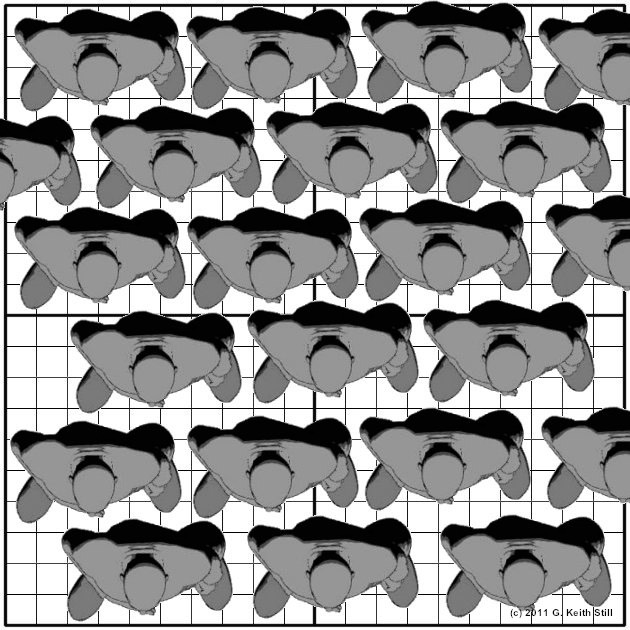
2.5 people per square metre
3 people per square metre
3.5 people per square metre
4 people per square metre
4.5 people per square metre
5 people per square metre (this should be the UPPER limit for standing/viewing spaces).
Below is a short video of a 100 square metre space with packing increasing from 1 person per square metre to 10 people per square metre. This serves to illustrate how the crowd may look in low risk and high risk situations. The safety limits for events are typically assessed at 2 people per square metre (UK Event Guidance). For a moving queueing system the guidance states 4 people per square metre. The guidance (UK Green Guide - Guide to Safety at Sports Grounds) states 4.7 people per square metre for standing viewing areas, but fails to highlight that the demographics (individual sizes) need to be factored into the density analysis.
Above - animated graph of the flow v density curve.
Below - image from the 3D crowd visualiser of 2 people per square metre (Wembley Olympic Way).
Density can appear higher with lower CCTV angles.
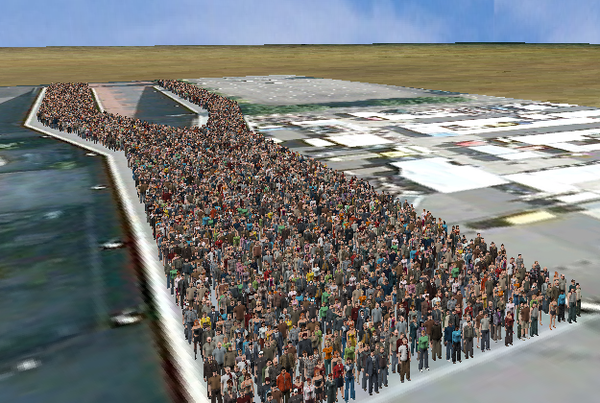
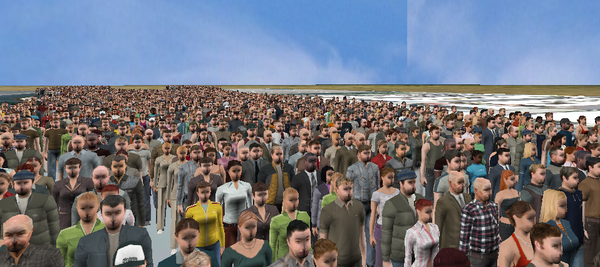
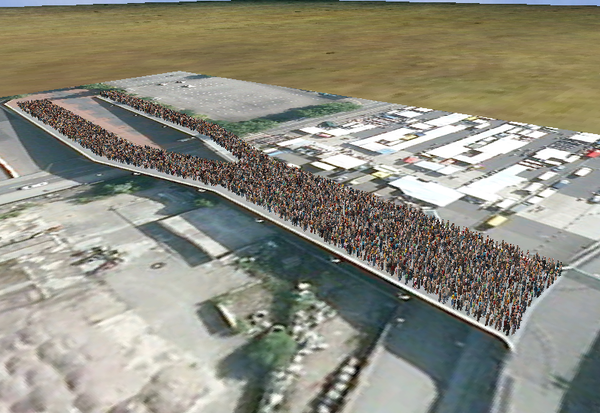
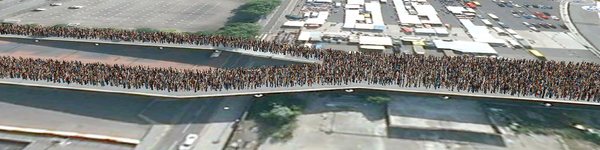
Above - images of 2 people per square metre from Wembley Olympic Way (using the 3D crowd visualiser)
_________________________________________________
Click here for information on our eLearning version of “Introduction to Crowd Science”
_________________________________________________
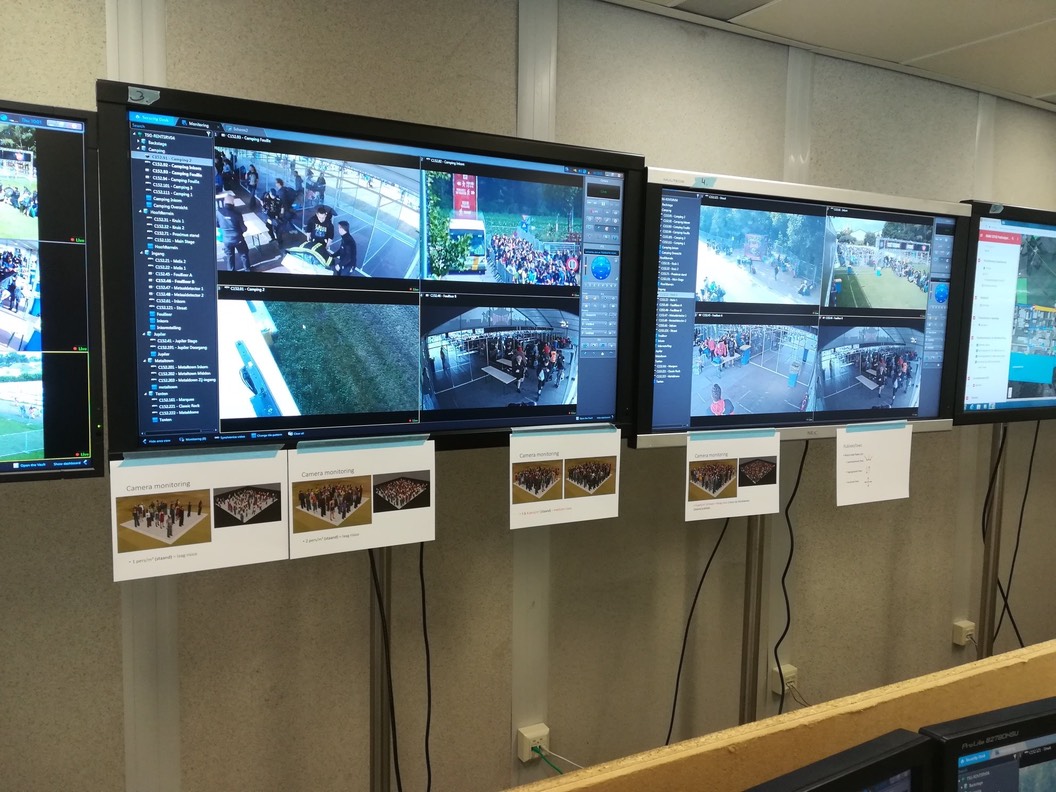
Using images in the control room for density reference
To download a set of density images - click on the link below
_________________________________________________
From the links below you can view a 10m grid, against a tennis court backdrop, to assist in visualising crowd densities and crowd sizes. I'm going to produce a whole range of crowds against backdrops to act as both a training aid and to provide reference visuals for assessing both density and crowd numbers.
Tennis court image 1 (100 Square metres)
Tennis court image 2 (100 Square metres)
Tennis court image 3 (100 Square metres)
Tennis court image 4 (100 Square metres)
Tennis court image 5 (100 Square metres)
Tennis court image 6 (100 Square metres)
Tennis court image 7 (625 Square metres)
Tennis court image 8 (625 Square metres)
Tennis court image 9 (625 Square metres)
Tennis court image 10 (625 Square metres)
Tennis court image 11 (625 Square metres)